
We are experts in map projections and coordinate reference systems. We offer knowledge and implementation from finding proper map projection for your map, georeferencing and reprojecting spatial data to programming. For example, we are authors of these two Leaflet plugins that help the use and understanding properties of Web Mercator Projection that is used in global map services such as Google Maps or OpenStreetMap.
Leaflet.EdgeScaleBar
Leaflet plugin that creates scale bars along the top and right edge of a map in the Web Mercator projection (visit on GitHub).
Change of linear scale with latitude in Web Mercator projection can affect the determination of distances from the map, especially for large areas. Standard scale bar corresponds to the map centre. This plugin gives variable scale bar along map edges (a concept used on nautical charts) which can be used to see the effect of linear scale change or for estimation of distances between objects. Simply by panning the map one can bring part of the map closer to the scale bar and estimate distance or size.
Leaflet.WebMercatorScales
Leaflet plugin that visualizes scales and distortions in Web Mercator projection (visit on GitHub).
Change of linear scale with latitude in Web Mercator projection can affect the determination of distances from the map, especially for large areas. Standard scale bar corresponds to the map centre. This plugin gives variable scale bar along map edges (a concept used on nautical charts) which can be used to see the effect of linear scale change or for estimation of distances between objects. Simply by panning the map one can bring part of the map closer to the scale bar and estimate distance or size. Moreover, the masked area of the map shows parts of the map that have more linear scale distortions >5% compared to the map centre, which means that they are visible by the naked eye (when compared with other maps with less linear distortions for that area). Isolines with constant linear scale along meridian and parallel can be shown, too.
ProjFactors
QGIS Plugin for map projections distortions visualisation (visit on GitHub).
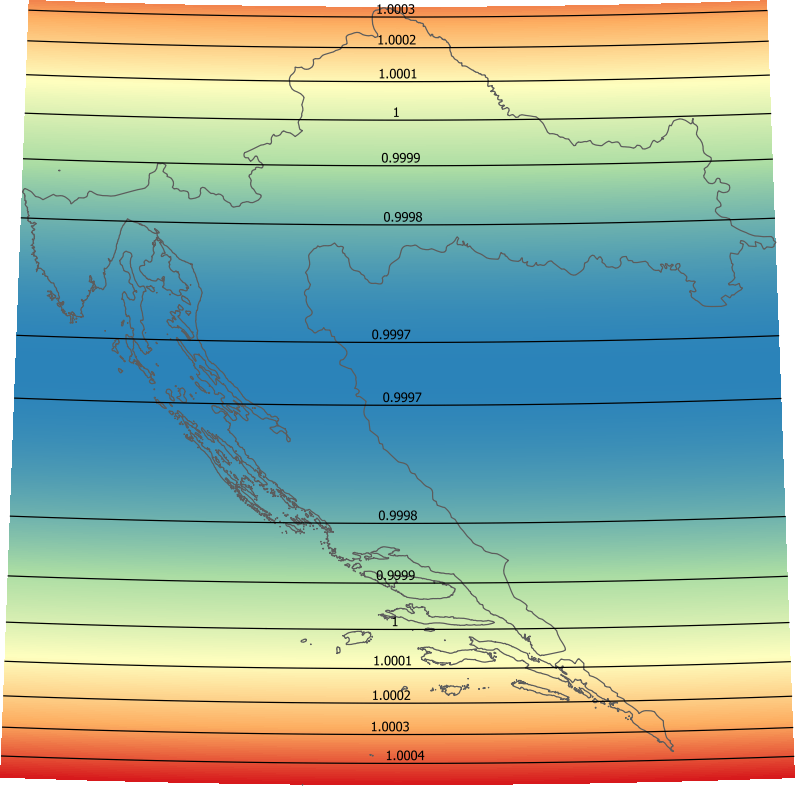
The main purpose of this plugin is to visualize distortions, scales or angles in the active area, i.e. over the area where data is present. This can help one to decide whether special consideration of distortions is necessary for calculations or analysis performed with GIS operations.
Visualisation of scales in cylindrical map projections
This animated visualisation gives insight into properties and scales in normal aspect cylindrical map projections.
Open animation in full window.
Find more how this interactive animation works and what it shows.